There have already been many posts/articles/books written about the subject of how CALCULATE and FILTER works, so I’m not going to repeat all that information here. Noteworthy resources (by “the Italians” of course):
In this blog post I’d rather discuss a performance issue I had to tackle at a client. There were quite a lot of measures of the following format:
CALCULATE(measureX,FILTER(tableY,columnZ = "expression"))
We can create a very similar measure using the WideWorldImporters data warehouse:

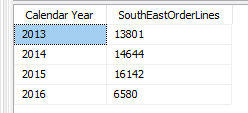
It simply calculates the number of orders placed in the SouthEast Sales Territory:

Now, the problem with this formula is that it uses FILTER, which means an in-memory table is constructed to evaluate the rows and calculate the output of the filter. For every row. Don’t get me wrong, FILTER is very flexible and powerful, but because of its iterator behavior it can cause problems for certain models, as here was the case. The performance issue is also described in a blog post by Rob Collie: Quick Tip: Don’t Over-Use FILTER().
The problem is easily fixed (as outlined in Rob’s post): just remove FILTER(), because DAX will re-add it implicitly but now it’s optimized.

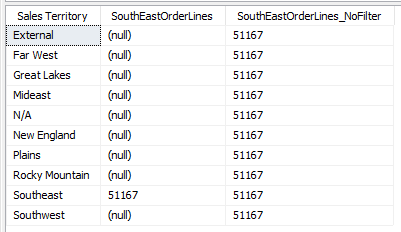
However, this has a small side effect:

When you include Sales Territory on the axis, the measure without filter repeats the same value for all values. This is correct though, as the ‘City'[Sales Territory] = “SouthEast” filter in CALCULATE overrides the current filter context of Sales Territory. The original measure however keeps the original filter context when it calculates the temporary results table of the FILTER function. This is why we get NULL values for all values except for the Southeast Sales Territory. Guess which one looks correct for the typical end user? The original measure of course. Which has performance issues.
My first instinct was to include some IF clauses to get rid of all the superfluous values of the second measure:
IF(HASONEVALUE(City[Sales Territory])
	,IF(VALUES(City[Sales Territory]) = "SouthEast"
		,COUNT('Order'[WWI Order ID])
		,BLANK()
		)
	,CALCULATE(COUNT('Order'[WWI Order ID]), City[Sales Territory]="SouthEast" )
	)
The formula works, but looks a bit clunky. Luckily I got some assistance on Twitter when I discussed the issue with Marco Russo:
Use the second one. Wrap with keepfilters if you want to obtain the same result of the first one
— Marco Russo (@marcorus) September 5, 2017
With the KEEPFILTERS function, we can rewrite the measure as follows:

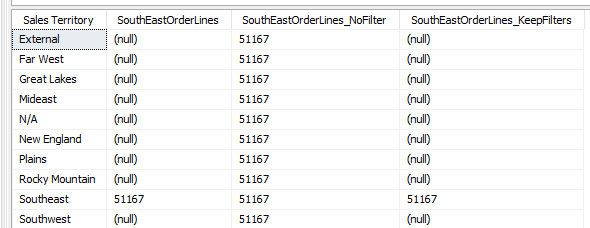
KEEPFILTERS will keep the original filter context, which means if Sales Territory is on the axis, it will actually filter the data:

The good news is of course the measure with KEEPFILTERS doesn’t suffer the same performance problem as the original measure, but it produces the same results. If you’re interested in all the nitty-gritty specifics, you can read chapter 5 and 10 of the excellent The Definitive Guide to DAX book.
------------------------------------------------
Do you like this blog post? You can thank me by buying me a beer 🙂
I’m curious: how does
CALCULATE(COUNT(‘Order'[WWI Order ID]), FILTER(VALUES(City[Sales Territory]), [Sales Territory]=”SouthEast”))
perform?
The difference is minimal. KEEPFILTERS is marginally better but the difference is barely measurable.
I tested it (on the actual model), and indeed it performs the same (at least I see no difference) with KEEPFILTERS. It does perform faster than the original measure (without VALUES).
Good – I was checking my own understanding of what was going on. Thanks!
Thanks. I’ve been doing PowerPivot since 2010, and KEEPFILTERS has eluded me. I know there’s old DAX code that could use this!
PowerPivotPro’s “Becoming One With Calculate” is also a good article–albeit not as up to date as to include KEEPFILTERS.