A semi-additive average? What exactly are you trying to calculate? Let me explain first. A semi-additive measure is a measure that can be summed across some dimensions, but not all. Typically it’s the time dimension that isn’t additive. For example, the stock level at various warehouses. You can add all the stock levels of your warehouses together, to get an idea of how much stock you have for your entire company. However, you can’t add the stock level across time. 250 stock yesterday and 240 stock today doesn’t equal 490 stock for the two days. In reality the sum aggregation is replaced with another aggregation when aggregating over the non-additive dimension. In our stock example, we could use the last value known (240) or the average (245). Which aggregation you want depends on the requirements.
In this blog post I’m going to calculate a semi-additive measure, using the average for the non-additive dimension. Quite recently a colleague asked how you could calculate this in DAX. The use case is simple: there are employees that perform hours on specific tasks. The number of hours is our measure. The different tasks (the task dimension) is additive. The employee dimension however is not when we calculate an average. When two employees are selected, the result should not be the average of all the individual hours, but rather the average of the sum of the hours per employee. Let’s illustrate with an example:
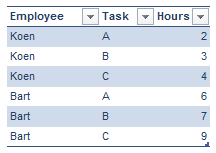
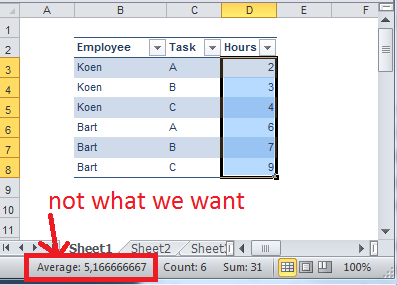
The total hours worked by Koen is 9, by Bart 22. When we want the average hours for all tasks, the result should be 15.5 (calculated as (22 + 9) / 2). However, if you use the regular average DAX function, you would get 5.17 (calculated as (2+3+4+6+7+9) / 6). So a new measure had to be created; one that first sums up the hours for each employee and then calculates the average across all employees.
If I learned anything from the Power Pivot and Power BI book about DAX, it’s to think in steps when you want to tackle a problem with DAX. First of all we want a measure that can calculate the sum of the hours (since we need the sum of the hours per employee).
Sum of Hours = SUM(Hours)
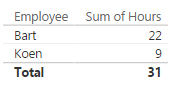
In Power Pivot and Power BI, if your column is of a numeric data type you don’t need to create such a measure; the engine will do it for you when you drag the column into a visualization. However, in SSAS Tabular you do need to create explicit measures for everything so it’s a good practice to create explicit measures every time. Besides, we are going to reuse this measure into another measure so even more reason to make it explicit. Used in a table with only employees, it gives the following result:
Not exactly rocket science until this point. Now we want to sum the hours per employee and then take the average. This is the exact definition of the AVERAGEX function. This function has the following syntax:
AVERAGEX(<table>,<expression>)
AVERAGEX is an iterator. It will iterate over the table provided in the first argument and for each iteration calculate the expression provided in the second argument. At the end, it calculates the average of all the results. What do we want to pass along as the 1st argument? A list of all the employees. We want to iterate over all of the employees and calculate the sum of their hours. The list of employees can be found with the VALUES function. The second argument is simply Sum of Hours, our explicit measure. This gives the following formula:
SemiAverage = AVERAGEX(VALUES(Employee);[Sum of Hours])
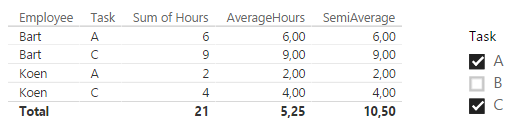
This gives the following result (compared with a normal average):
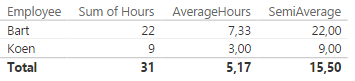
You can see that for a single employee, the SemiAverage measure behaves the same as the Sum of Hours measure. However, at the grand total line the average is taken from the various subtotals. The formula will still work with the task dimension included, since this dimension is fully additive.
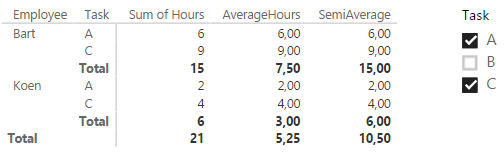
Let’s analyze how exactly the formula gives the end result of 10.50, line by line. To do this I’m going to use the matrix visualization, since it shows the subtotals.
The existing filter context is defined by two factors:
- the slicer, which dictates that only the tasks A and C are to be included.
- the position in the matrix. For example, the second line dictates that Employee = Bart and Task = C.
Using the filter context, we can go over each line and calculate the intermediate result.
- In line 1, the filter context is Employee = Bart, Task = A. If we would look at the original table, this gives us 6 hours. In our SemiAverage formula, VALUES(Employee) would just return Bart. The sum of the hours is 6 and there are no other employees (due to filter context). The average of 6 is of course 6.
- Same as line 1, but with Task = B. The result is 9.
- The subtotal for employee Bart has the following filter context: Employee = Bart, Task = All (remember that the slicer filters the tasks, so All in this context means A and C). The result of the expression Sum of Hours is 15 which is also the result for SemiAverage (again, only one employee is returned by VALUES(Employee)).
- The same as line 1, but with Employee = Koen and Task = A. Result is 2.
- The same as line 1, but with Employee = Koen and Task = C. Result is 4.
- The same as line 3, but with Employee = Koen and Task = All. Result is 6.
- In the grand total, the formula finally kicks in for real. Filter context is Employee = All, Task = All. VALUES(Employee) returns the table with values Koen and Bart. So in the first iteration, Sum of Hours is calculated for Koen. The result is the same as the subtotal of line 6. The second iteration calculates Sum of Hours for Bart, which results in 15, the result of line 3. Finally, AVERAGEX takes both results and calculates the average: (6 + 15) / 2 = 10.5.
A very long explanation for a very simple example 🙂
The point was to explain thoroughly how each value was calculated and how row and filter contexts behave.
In conclusion, we can use the following pattern to calculate semi-additive measures in DAX:
SemiAdditiveMeasure = AVERAGEX(VALUES(NonAdditiveDimension);SUM(Measure))
The AVERAGEX function can of course be replaced with other types of aggregations, such as MINX, MAXX, MEDIANX. Other types of semi-additive measures, such as last non empty, need other formulas.
------------------------------------------------
Do you like this blog post? You can thank me by buying me a beer 🙂
Thanks Koen , I was working on Dashboard for the average numbers of members by Plan, by Dep, and members_type, all by Year. In my first approach, I created several measures for each members_type , for each Plan and for each Dep to calculate the correct avg :
_____Example__________
AvgMembers:=AVERAGE(Claims[Members])
SubcribersAvgMembers:=CALCULATE([AvgMembers],Claims[members_type]=”Subscriber”).
_________________
*Then I read your post, and change the approach to semi-additive measures based on the YYYY-MM. I solve all my measure with only one measure:
_____Final__________
SemiAverageMem:=AVERAGEX(VALUES(‘Calendar'[YYYY-MM]),[TotMembers])