 I’ve currently been participating in the Microsoft Professional Program in Data Science. It’s an online curriculum of MOOCs (Massive Open Online Course), all provided through the edX platform. You are free to participate, but for a verified certificate you will need to pay (and Microsoft/edX has bumped up the price from $49 to $99 for some courses). Each course consists of video lectures (the best part is that you can set them to 2x the speed :), some hands-on labs and a final test.
Anyway, I’m half way the curriculum for the moment and I thought it’s a good time to share some of the experiences I had.
UPDATE: I forgot to add how long I did to take the actual courses. I’ve now added that information to each course. In overall, I found that the estimates given for a course are typically much longer than reality. For example, for a course the estimate is 4-8 hours a week, with a total length of 6 weeks. Most of the time you don’t need that amount of hours to finish a course (but of course your mileage might vary).
1. Data Science Orientation.
This is not exactly a real course, but rather an introduction to the curriculum. Your options are explained (you can choose between R and Python in some courses) and all of the steps to get the certificate as well. For some steps in the program, you can choose between different courses. For example, for “Applied Data Science”, you have the courses Applied Machine Learning, Implementing Predictive Solutions with Spark in HDInsight and Analyzing Big Data with Microsoft R Server. You need to choose between one of those courses, but you can also follow the other optional courses if you’re interested.
The orientation also explains some basic concepts of data, statistics and data science. There are some exercises, but they are not graded. The only action you need to take is to fill in some surveys. The biggest problem with this “course” is that you need to pay for the verified certificate, which you need to achieve the degree at the end. $99 for an introductory course, with concepts that are treated in the later courses seems a bit … excessive (see how I tried to avoid the word money-grabbing?). Anyway, with watching the videos at 2x the speed you can very quickly finish this course and scratch it off the list (I finished this course in a couple of hours).
2. Querying with Transact-SQL
Not really sure why this course is included (I haven’t used T-SQL in any of the other courses yet), but I do believe that anyone working with data should know some SQL. The course is on edX, but is provided through Datacamp, a Belgian company providing the web with online data science courses. Since I have quite some SQL experience, I decided the skip the lectures – I do think I know the difference between left and right outer join – and just go to the labs. The labs use the Datacamp environment, where you can write and run T-SQL queries against an online database (a lightweight AdventureWorks sample database). Most of the labs went just fine, but there were quite some issues with the online environment. The connection kept being interrupted. Some of the issues were solved during the course, but the experience was far from perfect. I remember one particular lab where we had to write INSERT and UPDATE statements. Except that the transactions didn’t commit, so inserted data didn’t show up so SELECT statements later on didn’t return the required data. Quite frustrating if you know your queries are 100% correct but the system just won’t accept them (I cross-checked them against my local instance of the database). In the end I could finish all labs successfully though. The lab itself was quite OK, there were no issues there.
I finished this course in a couple of days, but I only had to do the labs and the final test. I estimate a maximum of 10 hours spent on this course.
3. Analyzing and Visualizing Data with Power BI
For the third step, you can choose between analyzing & visualizing in Excel or in Power BI. I choose for the Power BI course. I actually followed this course way back in 2015 when it was originally launched. The lectures are given by Will Thomson from the Power BI team and they are quite excellent. The labs are fine as well, they teach you the necessary concepts of working with Power BI. All in all, a solid course for getting some basic knowledge about Power BI.
I finished this course in a couple of hours, because I already watched the lectures and did the labs in a previous iteration of the course. I just had to fill in the values for the labs (I only had to redo on lab because something had actually changed). The first time I took the course I finished it in a couple of days, the labs really aren’t that hard (and I already had a solid Power BI understanding).
4. Essential Statistics for Data Analysis using Excel
This was the course were I probably learned the most (so far), but that’s because I kind of sucked at statistics in university. The course has two lecturers, one for the theoretical slides and one for the practical lessons in Excel. The lectures are decent, explaining concepts thoroughly and giving good practical examples. The labs are good too: they enforce the concepts learned and they will actually will make you think about the problems. It was quite some time since I had to whip out pen and paper to do some math. However, the quizzes and final test had one flaw: the questions. A lot of questions were ambiguous and open to interpretation. Sometimes the “correct” answer was badly explained or sometimes even incorrect. I used to read the discussion forums first to see if there was some commotion about a question before I tried to answer it. The most terrible experience was a question about Pareto charts (aka the 80/20 rule).
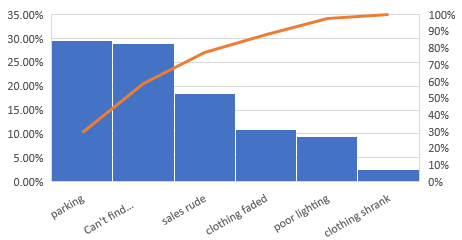
The question was obvious: on which issues should you focus? Focusing on the first two gives you about 59%, focusing on the first three issues will cover about 78% of the customer complaints. Since the topic is 80/20 rule, you’d think the last option. Wrong. The quiz expects only the first two issues. The reasoning is that you should focus on the largest issues only. OK, lesson learned. In the final test however, you get a similar question with almost the exact same numbers. The correct answer? Focusing on the first three issues.

It’s mistakes like these that made the course less enjoyable for me, even though I learned some interesting things (probabilities, distributions, hypothesis testing, sampling). This course took me the longest so far. I spent most of the time on the labs, which were a bit harder for me than in other courses. You actually have to calculate values by hand like in high school (and that was quite some time ago for me :). I think the whole course took me about a month (not full-time of course, a couple of hours a week).
5. Introduction to R for Data Science
For “Exploring Data with Code”, you can choose between an R course or a Python course. I chose the R course, since I already have a little bit of experience with the R language. The course is again provided by Datacamp, but in contract with the T-SQL course, everything was flawless. Interesting lectures, good labs and a decent final test. The only remark I have is that the course is really basic, it doesn’t touch the more advanced topics (such as plotting with ggplot2 or lapply), however they will probably be explained in a later course. In short, a recommended course.
I finished the course in a couple of days. I watched the lectures at twice the speed and the labs were quite easy. The final test is timed and you can only take it once, but I finished it under an hour.
6. Data Science Essentials
This is an introductory course to data science concepts. There is some overlap with the Statistics in Excel course, but this course tends to be a bit more practical. For the hands-on labs, Azure ML is used in combination with Jupyter Notebooks. All in all, the course gives a good basic introduction to some machine learning concepts, such as regression, classification and clustering. The labs are way too easy though. You just need to follow the steps explained in the lab documents and you’re good to go. In the final lab, they don’t hold your hands quite as much, but it’s still a walk in the park. It’s really hard not to get 100% on this course; it really feels like a tutorial into Azure ML and Jupyter notebooks. The only “problem” with the course is that some of the R code used in the labs is considerably more complex than the R you learned in the previous course. Not really an issue since you just need to execute it, but there is some gap there.
I finished this course in a couple of days. Lectures at twice the speed and just followed instructions for the lab. The final test took me under an hour to finish it.
Anyway, that’s all the courses I’ve done so far. I’ll blog about the other courses once I’ve finished them.
------------------------------------------------
Do you like this blog post? You can thank me by buying me a beer 🙂
Don’t forget to read your fellow countryman’s book–if you can get through the sometimes “less than humble” writing style and the “if you don’t have my skill set and experience don’t call yourself a data scientist” tone.
Unfortunately, it reads like a hodge-podge of mind dumps/consciousness streams and really (like most bloggers these days) just seems to be an amalgamation of blogs thrown together into a book. Furthermore, if you do not have a stats, mathematics, and/or a computer science background, it could come off as quite esoteric, but I guess that’s the point (to show how broad, yet detailed data science can be). However, that book is NOT a bad way to validate what you have learned to see how far you have come. Polyvalence rules!
I didn’t read it. I used to read his blog but I got quickly tired of his arrogance.
Wayne WInston (Excel 2013/2016 Business Data Modeling) has a great teaching style for making sure you KNOW the material you were just taught by stretching your brain to concepts you learn in SUBSEQUENT CHAPTERS but have not yet been taught (and frustrating the hell out of you)! It’s almost like the same way schools separate the accelerated track students from the straight up geniuses.
I can just hear your fellow countryman whispering “it’s fake data science”.
Speaking of your country, one of my favorite things to come out of it is DJ Jessy 🙂 hahahaha…..