The audience mainly focuses on power users: people that know Excel and can behave themselves with a little bit of code. If your students are less tech-savvy, you can skip the modelling part and just create some cool reports. The workshop consists of free and open data. It starts from the IMDB Top 250 Movie list and enriches this list with extra data from the omdb (Open Movie Database) API. You only need an Internet Connection. Some screenshots:
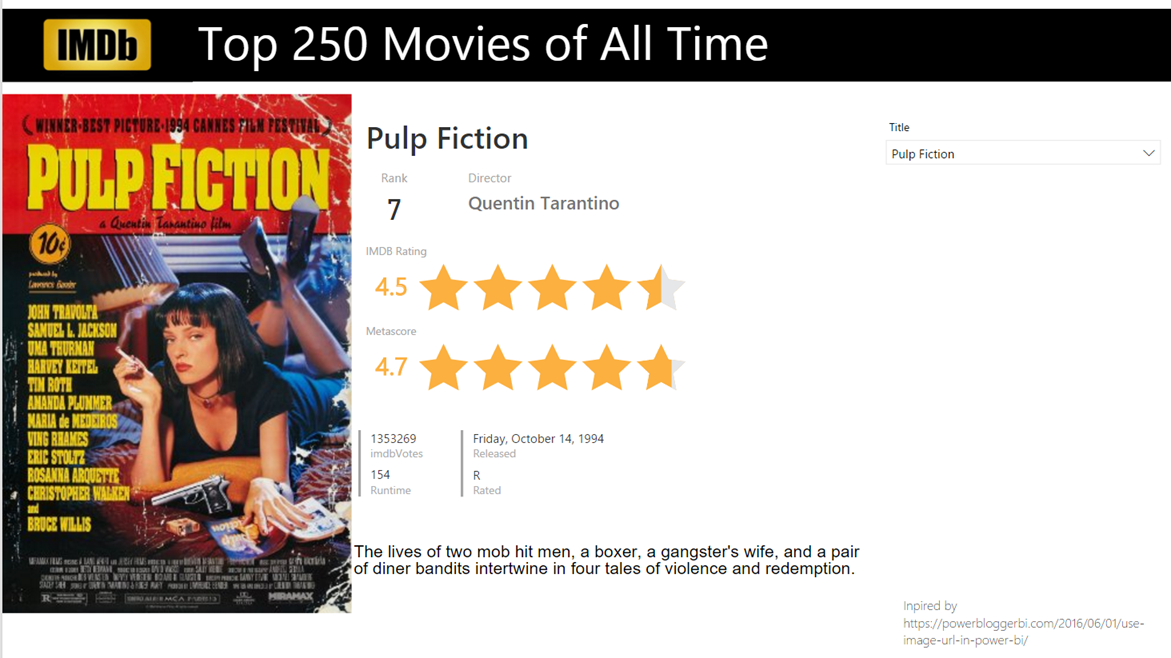
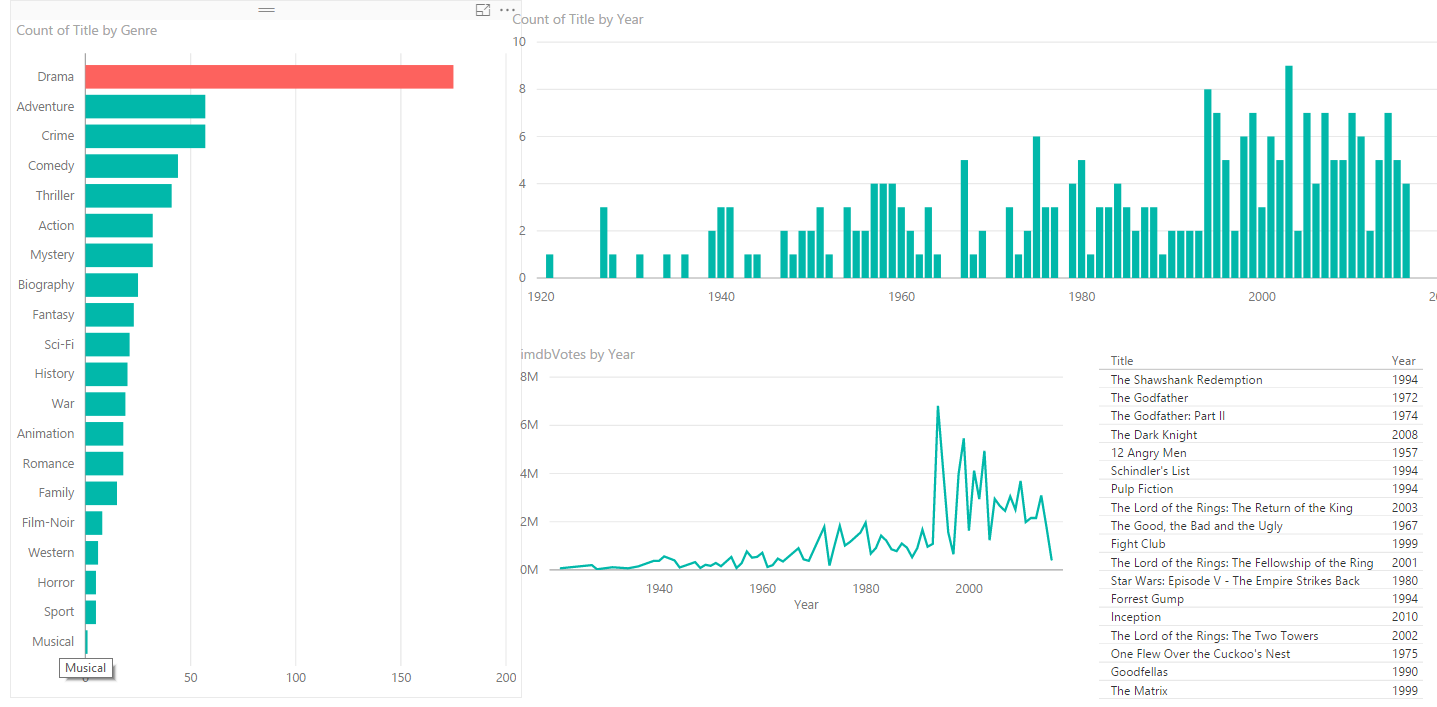
The .pbix file contains a set of reports, where each reports shows different features of the tool. Some focus on new additions from the last couple of months. There’s also a little DAX involved, but mainly to show how calculated columns and measures work, and how filter context behaves.
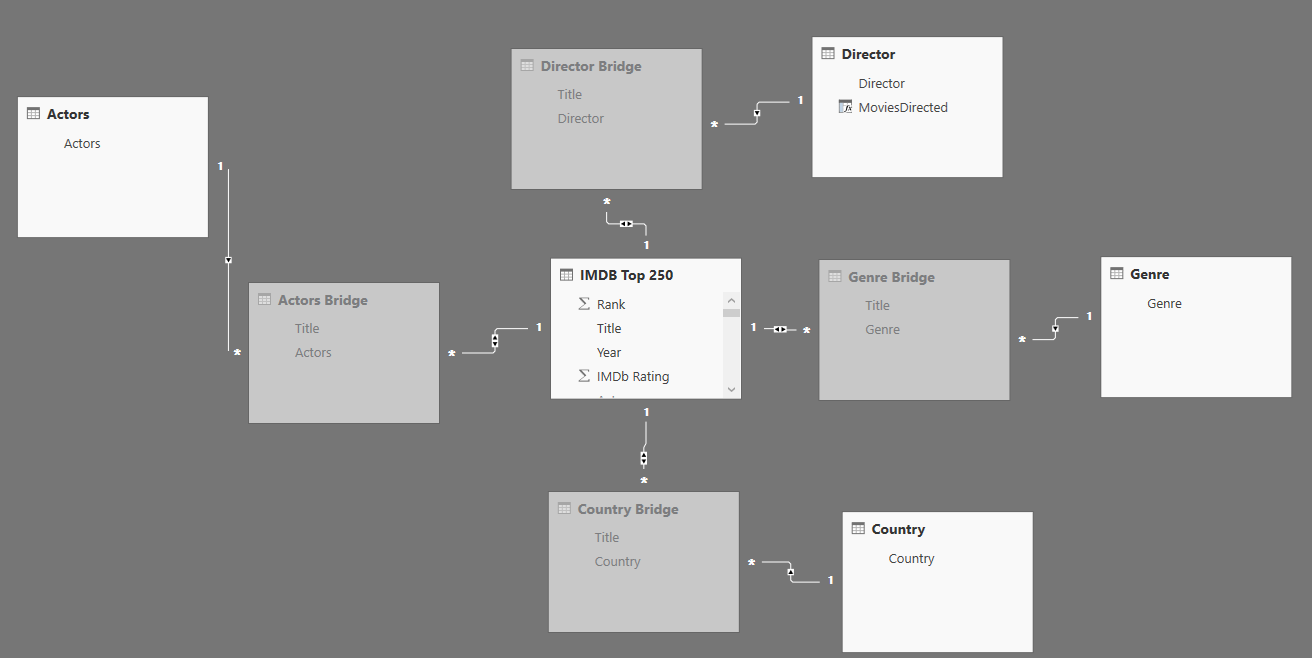
The data is fetched with Power Query and a query has been turned into an M function (this is one part where a little code can be involved). Because the data contains a lot of comma separated lists (multiple directors, multiple genres, multiple countries …), they are all split out into many-2-many relationships (a good learning opportunity for bi-directional cross-filtering). Because of the way caching behaves (or doesn’t) refreshing the model can take quite some time (although there isn’t much data involved). I haven’t been able to solve this yet. To circumvent this, there are .pbix files provided that match with the start or end of certain exercises. For example, in the exercises you’ll create only one many-2-many relationship. The next exercise starts with all the other relationships already created. Otherwise the exercises would be a bit too repetitive and boring.
The workshop is quite basic now, but I’ll expand it in the future with more guidelines, hopefully more features and maybe corrections as well. Maybe I’ll create a recording where I explain all the material, but that’s for later. Now, where can you find all the goodies?
- you can find the source files on Github. There’s a .pbix file (a Power BI Desktop file) that contains the model and sample reports. On Github, you can also find the exercises.
- the accompanying slide deck can be found on Onedrive. If you download the PowerPoint file, you’ll see I added a lot of notes explaining each slide.
All the material is licensed under the MIT license, which means you can use it for all purposes (give trainings at your colleagues, at your clients or use it to learn more about Power BI yourself) as long as you keep the copyright notice.
That’s it for now. If I make updates to the workshop, I’ll update this blog post as well.
If you happen to use the materials and give a presentation/workshop, let me know in the comments how it turned out. If you have any feedback or suggestions, please post them in the comments as well.
UPDATE 2017-02-16: I made some significant changes to the data sources. More info: Updates to the Power BI course.
------------------------------------------------
Do you like this blog post? You can thank me by buying me a beer 🙂
Very cool concept! One thing to check: Did you check the compatibility / implications of including Melissa’s already CCC-Attribution-NoDerivativeWorks-3.0-licensed content within your course, released under MIT license?
Oh, well. I guess it’s ok given the “human readable” explanation of the license. Was just curious :-). https://creativecommons.org/licenses/by-nc-nd/3.0/
I added an attribution on the slide, with a link to the source material so I assume it’s ok?
People shouldn’t modify that exact slide though 🙂
Yes, it’s ok (as far as I can see). I was just curious; other Open Source licenses sometimes don’t mix & match (especially the “copyleft” GPL ones)
Very cool work Koen. I’m teaching a Power BI class here in Iceland in April and might use some of your work in that. I will at least take a look and give you some feedback if there is any.
Great! Let me know how it went 🙂
Please allow me to ask you a trivial question: In the Fields pane I saw some small icons in front of the fields, I could recognize 2 out of them, would you like to explain for me the one for “Rated (groups)” and another one for “Metascore_Star” in this workshop? Thanks.
Hi Julian,
Metascore_Star is a calculated column (with DAX). It scales the score to a number between 1 and 5 so it can be used with the stars custom visual. The icon you see indicates the column is calculated by an expression.
Rated (groups) is an automatic calculated column by using the grouping and binning feature of Power BI Desktop. This means the column was created by the model itself. You can find more info on grouping in the following article:
https://powerbi.microsoft.com/en-us/documentation/powerbi-desktop-grouping-and-binning/
Thanks for your informative input. I got it.
Hi,
I tried this yesterday and was delighted. A strong, practical introduction to Power BI. The exercises were clear but non-trivial, quick and engaging.
Superb work!
Thanks!