
When the PowerBI desktop is connected the tabular model, a lot of features , such as grouping, creating new columns, are all disable, why? is there a way to enable those features?
Unfortunately not. Some features are for “Import mode” only and cannot be used when using a live connection to a SSAS server. Grouping for example, creates a new calculated column in the model. Since this is not possible for the moment for live connections, the feature cannot be used.
can a data source be a server log?
Sure. Power BI Desktop can handle multiple text formats, such as delimited, fixed width, JSON and XML.
how did you set the defaut slicer to continuous? I remind it should show the list of all possible values and a little square for each
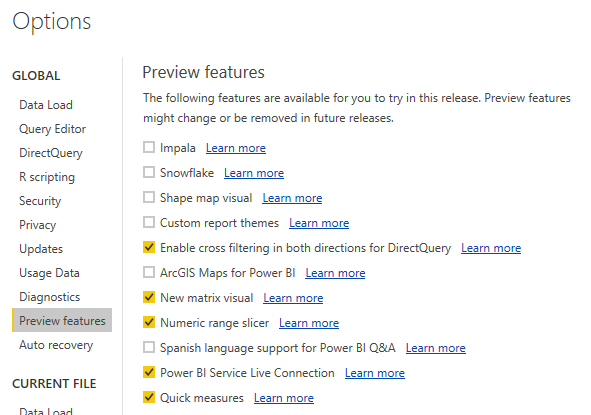
This only works for numerical or date values. Make sure you have the latest version of Power BI Desktop and that this preview feature is enabled.
when u import second data source, how did the data automatically match by title?
Well, it didn’t happen magically/automatically. I merged the two queries. In the merge dialog, I configured that both queries are merged using the Title as the join column.
Does the sort order of the data matter in compression?
Yes, it probably will. It’s all a bit of a black box, but it is known you can influence compression by pre-sorting columns. For example, when using columnstore indexes (which uses the same compression techniques), you can affect the compression by creating a clustered B-Tree index first on the column and then creating your columnstore index. In that case, the segments of the CI are neatly in order for the column of the clustered index.
Whether PowerBI has the calculation field function like Tableau?
No idea, it’s been a while since I used Tableau. Power BI Desktop has the quick measures functionality since the latest update (April 2017), so it’s worth checking it out.
Can PowerBI be used completely on premises, no cloud and have dashboards distributed to managers.
In SQL Server vNext you can deploy Power BI Desktop to your on-premise SSRS server. The problem is that there will be no dashboards (the collection of tiles in the Power BI service). The only “alternative” are SSRS Mobile Reports, based on the DataZen technology. I’d rather turn my Power BI Desktop reports into dashboards.
using power bi desktop and direct query you can use parameters
Not sure this is a question or a statement. There’s a bit of conflicting information on the interwebz, but I tested it and it seems to work. You can use a parameter to load data from SQL Server using DirectQuery (and the parameter is folded back to SQL Server).
when can we our own self made content packs in the Desktop?
No idea.
Is it possible to create a model in PowerQuery in Excel and use it in PowerBI? Or create centralized models that can be used by all PowerQuery products?
Yes, you can import your Power Query queries and your Power Pivot models into Power BI Desktop. It’s a one-way street though, it doesn’t work the other way around. You can connect an Excel file to a model published in the Power BI service using the Analyze in Excel feature. Since April 2017 it’s also possible to re-use models published in the service. You can connect Power BI Desktop to a model in the service and use that model as a live connection.
He seems to be conducting the webinar from a CIA saferoom.
True. Now I have to kill any viewer of the webinar. Kidding, it’s just my (unfinished) attic.
Can you use stacked columns with the groupings. So the unrated could be shown as different colors within the bar?
I believe I answered this in the webinar itself. I hope, because one month later I have no idea what this question is about 🙂
Do you have a recommendation for a time slicer? (not date, just time)
This was a question posed in the Q&A of the webinar. I didn’t have a clear response at the time, so I promised to investigate. Which I did. The conclusion is: Power BI Desktop handles time poorly. When you add a time column to a slicer, PBI Desktop will turn it into a date slicer with only one date (I believe 1899-12-31 or something similar). When you change the slicer to a default one (dropbox or list), it shows the time but the seconds are cut off. Not useful. So my recommendation is to use time intervals instead as a slicer (for example 0AM – 1AM).
Also, is there a slicer which performs a text search for maching values within a column just like you searched for the values within your Title slicer?
You can enable to search option on a slicer and then you can search for values within the column.
on the page3 where he showed a bar chart with grouping on the rating (none, other, PG). Is it possible to change the order the item on the Y axix appears based on the grouping? e.g.) Items under PG group on the top , then Others grouping next, then None group on the bottom.
Yes. Since the grouping adds the result as a new column to the model, you can define a sort column on this column.
Where is the prepared table saved? Is it saved to an SSAS instance or in local memory?
In import mode, the data is stored in memory. When you close the file, the data is saved in the .pbix file.
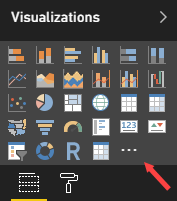
How do you add the custom visualizations to the available pallette?
You download a custom visual from the gallery. Then, in Power BI Desktop, you click on the ellipsis in the visualization pane. You can then browse to the downloaded custom viz and import it.
Could we download the final power BI file that the presenter is creating?
Sure, you can find it on Github.
Power Query in Excel is the same as Power Query in Power BI.
More or less, yes. Power BI Desktop is updated more frequently, but both are the same engines.
And when is the data refreshed? Say when the source data (the top 250 movie list) changes?
Either manually in Power BI Destkop, or scheduled when you upload the file to the Power BI service. If the sources are local, you need a gateway.
If a user has a number of databases with identical structure or different data content like a database per plant for a company with several plants can the power BI connection be made dynamic where the user can select the desired database from a list of available databases when viewing a report?
Yes, that should be possible. You can pass the name of the desired database as a parameter to the query or you can create a function. It does assume identical metadata though. You can find an example in this blog post by Chris Webb.
Can power BI write a record to a database. For example show a set of data for the production last shift toaa supervisor and allow the supervisor approve the results and possibly add a comment?
Not at the moment. In SQL Server vNext you can host Power BI Desktop on the SSRS server. There will be a feature available to add comments to a report. But writeback is currently not supported.
is it possible filtering data by a parameter? for example if I have a report for SalesAgents, can an agent visualize his own data passing SalesCode?
Yes you can, use query parameters and templates.
That’s it. I hope everyone enjoyed the webinar. You’re welcome to join me at Techorama for a live version!
------------------------------------------------
Do you like this blog post? You can thank me by buying me a beer 🙂